AARP estimates that there are over 53 million caregivers across the United States1. This equates to roughly 1 in 6 employees providing unpaid care to family members or friends. While caring for loved ones can be deeply fulfilling, it also leads to increased stress, reduced productivity, and higher absenteeism. The ripple effect extends beyond the family unit, as colleagues and employers are also impacted.
To attract and retain top talent, employers have started to reprioritize caregiving benefits. Historically, organizations recognized a gap in child and adult care services, and have responded by offering onsite or nearby care centers along with backup care services to boost presenteeism. While these solutions addressed the immediate logistical challenge of caregiving, they often overlooked the emotional burden on caregiving employees.
Recently, forward-thinking employers have adopted a more holistic approach to caregiving, resulting in a more satisfied and engaged workforce. Caregiving benefits commonly fall into five categories: time off, financial support, referral services, care centers, and emotional support.
Time Off: This includes enhanced policies for parental or family leave and flexible work arrangements like hybrid or remote work, which allow employees to better manage their caregiving responsibilities. Employers may provide additional leaves on top of federal or stated mandated requirements.
Financial Support: Employers may offer stipends, dependent care assistance plans, subsidized child or backup care, or financial incentives linked to broader employee benefits, such as Health Savings Accounts or maternity care programs.
Referral Services: For employers with limited budgets, services such as care navigation, employee assistance programs (EAPs), and educational resources can offer significant support.
Care Centers: Larger employers with a geographically concentrated workforce may continue to offer onsite childcare centers or partner with external providers for backup child and adult care. This is particularly vital in regions with long childcare waitlists, an issue worsened by the COVID-19 pandemic when many in-home daycare providers did not reopen2.
Emotional Support: Perhaps the most critical, this category includes coaching, support groups, and integration with mental health services. While much attention is given to the transition into parenthood, fewer resources exist for employees who must care for aging parents with declining health, a role that can be devastating and isolating without proper support.
Though the return on investment (ROI) for caregiving benefits can be difficult to quantify, many employers find it results in reduced turnover, increased employee satisfaction, and fewer unplanned absences. This may also be an important benefit when working to recruit new employees. A phased approach that begins with lower cost options, builds awareness, and later expands the benefit offerings can be an effective strategy for organizations beginning this journey.
While caregiving support is advisable for all employers, it becomes essential when employee loyalty and work-life balance are core aspects of your company culture. Additionally, caregiving benefits can be a valuable negotiation point in union discussions, particularly when retention is a shared concern, and the workforce includes those in the “sandwich generation”—employees caring for both young children and aging parents3.
The easiest and fastest way to show you are a caring employer is simple. Care for your caregivers.
1AARP. (2020). Caregiving in the U.S. https://www.aarp.org/ppi/info-2020/caregiving-in-the-united-states.html
2Center for American Progress. (2021). The Child Care Crisis Causes Job Disruptions for More Than 2 Million Parents Each Year. https://www.americanprogress.org/article/child-care-crisis-causes-job-disruptions-2-million-parents-year/
3Pew Research Center. (2013). The Sandwich Generation: Rising Financial Burdens for Middle-Aged Americans. https://www.pewresearch.org/social-trends/2013/01/30/the-sandwich-generation/
Substance use disorder (SUD) is often discussed in relation to student health and wellness across colleges and universities. Just as important, but sometimes overlooked, are faculty, administrators, and staff who may be silently struggling with substance use or supporting loved ones who are.
When schedules are demanding and support systems may be limited, institutions can better support their workforce by offering comprehensive and stigma-free solutions related to SUD and recovery.
Understanding Substance Use Disorder
Substance use disorder is a chronic condition affecting millions of Americans. It’s often characterized by the compulsive use of substances such as alcohol, prescription medication, or illicit drugs despite harmful consequences, with impacts felt across all socioeconomic, professional, and educational backgrounds.
According to the National Survey on Drug Use and Health, about one in eleven full-time workers struggles with SUD, and nearly 12 percent of U.S. adults live with someone in recovery. ¹
Why It Matters
Workplace cultures that reward overworking, multitasking, and perfectionism may add to the pressure. In education specifically, faculty and staff may silently manage stress or avoid disclosing personal struggles out of fear for their careers or a desire to prioritize student health. Since academic institutions influence the broader community, unaddressed employee struggles can impact student experience, productivity, and retention.
Supporting recovery is more than a wellness initiative, it is a cultural responsibility and a strategic investment in employee wellbeing.
What Recovery-Supportive Workplaces Can Offer
Limitless options exist in supporting employees with substance use disorders or those who are caregivers for family and friends with similar challenges. The most common is to provide programs that focus on this area, but perhaps even more important is to foster a culture that allows employees to take advantage of these programs and feel supported.
Programs that should be considered include, but not be limited to, the following:
Employee Assistance Programs (EAPs)
EAPs can provide free counseling, treatment referrals, and crisis support. Promoting awareness and confidentiality is essential to building trust in these services.
Recovery-Focused Benefits Platforms
Some employers partner with vendors to provide treatment matching, sobriety coaching, medication-assisted treatment, and caregiver resources.
Flexible Leave Policies
Non-punitive leave for treatment and recovery can make it easier for employees to seek help. Review existing policies to ensure they support behavioral health needs.
Caregiver Support
Employees supporting a loved one through addiction need resources, too. Solutions that offer navigation support, stress management, and mental health care can ease the burden.
Training for Managers and HR
Educating leadership on how to recognize signs of SUD and refer employees to resources ensures the first response is supportive, not disciplinary.
Campus Recovery Communities
Some colleges have launched employee recovery groups or partnered with local organizations like AA or NA to provide safe, supportive spaces.
Breaking the Stigma
Regardless of the programs implemented, the culture within your organization can directly impact success. Stigma remains one of the greatest barriers to seeking help. Misconceptions that SUD is a moral failing rather than a health condition prevent many from accessing support. This is especially true in academia, where self-sufficiency and achievement are often prioritized.
Using person-first language—such as “person with a substance use disorder” instead of “addict”—can help humanize and normalize these experiences. Institutions that model this language in policy and communication help shift the culture.
If this bias exists, it likely extends beyond SUD to all mental health or substance use concerns. Therefore, adopting a culture that actively works to break the stigma will help all employees.
1Substance Abuse and Mental Health Services Administration. 2022 National Survey on Drug Use and Health (NSDUH).
2SAMHSA National Helpline: https://www.samhsa.gov/find-help/national-helpline
3Shatterproof Treatment Atlas: https://treatmentatlas.org
Rapidly emerging technologies are now guiding patients through the complexities of the healthcare system and helping them receive care that best fits their individual needs. Artificial intelligence (AI) is being used to bridge gaps in healthcare access by supporting patient navigation, ensuring patients understand their options and are directed to the most appropriate providers, care settings, and treatment paths. Although many tools are working behind the scenes, the benefits to patients and providers are vast, but must be carefully monitored to avoid inadvertent consequences.
Patient Data Management
Electronic health records (EHRs) store vast amounts of information, much of which is unstructured. Natural language processing (NLP), a subset of AI, can interpret and extract meaningful insights from these notes, making them useful for predicting diagnoses and delivering individualized care recommendations. This significantly improves data accessibility, especially when extracting information from scanned documents, which have long posed challenges. It also contributes to cost reduction and enhanced care quality. The ability to mine patient data will allow providers to more quickly assess care and make recommendations, sometimes based on systematic analysis.
Automated Communication
AI-powered chatbots and virtual health assistants are transforming communication in healthcare, enabling instantaneous, 24/7 interactions that improve patient engagement. These tools can respond to routine inquiries, offer care options, provide health advice, and remind patients about appointments or medications. This kind of around-the-clock support enhances convenience and personalization, making healthcare navigation more user-friendly and patient-centric.
Provider Matching and Scheduling
AI-driven scheduling platforms and algorithms help patients identify and access the most appropriate healthcare services while also improving operational efficiency for providers. These tools match patients with in-network providers based on personalized criteria such as location, insurance, and specialty. AI and machine learning applications can find appointment slots that meet patient needs, factoring in provider availability and urgency of care. One powerful feature is real-time adaptability, which enables appointment reallocation to accommodate urgent cases with minimal disruption. The result is reduced wait times, better resource allocation, greater transparency, and improved patient satisfaction.
AI Detection
AI is highly effective in identifying patterns and correlations to aid in the prediction and diagnosis of diseases. Several case studies highlight AI’s growing role in early detection and risk prediction for conditions such as cancer, diabetes, and heart disease, as well as other chronic illnesses. As machine learning and NLP algorithms are exposed to more data, their accuracy and reliability continue to improve. Early identification helps shape the course of treatment and enables timely intervention. Another cutting-edge advancement is symptom analysis and virtual triage, where patients can conduct self-assessments and receive guidance on when and where to seek care. This empowers patients with accessible information and helps reduce unnecessary visits to the emergency room.
The Future of AI-Powered Care Navigation
The use of AI in healthcare navigation will continue evolving and further revolutionize the patient experience. One major trend is the movement toward highly personalized care, with AI tailoring guidance to each patient’s unique needs. Future developments may include enhanced AI features in medical imaging for diagnostics and greater integration with wearable health monitoring technologies. While AI-powered navigation tools have already made significant progress, there remains vast potential to further streamline the patient journey and break down access barriers. This will ensure timely, effective, and patient-centered care.
Source: Maleki Varnosfaderani, S., & Forouzanfar, M. (2024). The Role of AI in Hospitals and Clinics: Transforming Healthcare in the 21st Century. Bioengineering (Basel, Switzerland), 11(4), 337. https://doi.org/10.3390/bioengineering11040337
CAs focus continues to grow on mental wellbeing and diversity, the concept of neurodiversity has garnered increasing attention. Neurodiversity refers to the range and variation in how human brains function, and includes conditions such as autism, ADHD, Tourette’s, dyslexia, dyspraxia, social anxiety disorders, and more. Recognizing and supporting these differences can foster inclusivity, innovation, and personal wellbeing. Cognitive wellness tools are playing a crucial role for employers looking to help all employees thrive.
Neurodiversity challenges the idea of a single “normal” brain type. It highlights that neurological differences are not deficits, but rather variations in processing, communication, and learning. While the potential benefits of hiring a diverse workforce are high, reports estimate that the unemployment rate in the U.S. for neurodivergent individuals is between 30% and 40%.[1] Embracing neurodiversity promotes equity in education, work, and healthcare by acknowledging the unique strengths and needs of each person. In addition, neurodivergent individuals may be highly skilled, more productive, and exhibit different strengths than neurotypical individuals, such as attention to detail or direct communication skills.
To address this gap, various tools—often referred to as cognitive wellness tools—have emerged. Cognitive wellness focuses on supporting brain health and functionality through personalized strategies. For neurodivergent individuals, this may include tools that assist with executive function, focus, emotional regulation, and sensory processing. Investing in cognitive wellness has been shown to reduce burnout and improve productivity—not just for neurodivergent individuals, but for all employees.
There are a variety of tools available:
- Digital Apps: Tools like MindMeister, Todoist, and Calm help with organization, mindfulness, and task management.
- Assistive Technology: Speech-to-text software, noise-canceling headphones, and screen readers enhance accessibility.
- Therapeutic Supports: Cognitive Behavioral Therapy (CBT) adapted for neurodivergence, occupational therapy, and coaching foster self-understanding and practical skills.
- Workplace & Educational Tools: Flexible work arrangements, sensory-friendly environments, and universal design principles empower success in diverse settings.
In addition, employers must comply with laws such as the Americans with Disabilities Act (ADA), which may extend to certain neurodivergent conditions, including autism or ADHD. This means that employers may be required to engage in the interactive process to ensure employees and prospective employees are provided with fair opportunities to succeed. Possible accommodations include:
- Sharing interview questions in advance; keeping them short and direct; avoiding evaluation based on tone, body language, or expressions
- Using explicit, written communication when possible
- Manager support in creating weekly plans
- Flexible deadlines or additional time to complete tasks
- Consistent job roles, routines, and team structures
- Scheduled breaks
- Adjustments to sensory elements such as temperature, noise, or scents
Supporting neurodiversity through cognitive wellness tools is more than just a trend—it’s a necessary evolution. By integrating technology, therapy, and systemic accommodations, we can empower neurodivergent individuals to thrive and contribute their full potential in the workplace.
1 https://imagine.jhu.edu/blog/2022/10/05/neurodivergence-at-a-glance/
As spring unfolded, the 2025 Disability Management Employer Coalition (DMEC) Compliance Conference brought together absence management professionals from across the nation to explore emerging trends, compliance strategies, and innovative solutions in the world of leave management. Held in Columbus, Ohio, this year’s conference offered in-depth sessions on pressing issues, including compliance, mental health accommodations, technological advancements, and diversity in the workplace. Here’s a look at some of the key topics that were discussed:
1) Navigating Complex Compliance Challenges
With the ever-changing landscape of leave and accommodation laws, staying compliant remains a top priority for employers. This year’s conference offered valuable insights into managing the intersection of federal and state regulations. Experts shared practical advice on how to avoid common mistakes and streamline compliance efforts across diverse workforces. Here are some noteworthy sessions:
- DOL Updates: 2025 and Beyond
This session offered a deep dive into upcoming changes to the Department of Labor’s regulations and what HR teams need to do to stay ahead of the curve.
- When the PWFA, ADA, PUMP Act and FMLA Intersect: How to Unravel from a Tangled Mess
Speakers unpacked the complexities of these intersecting laws and shared strategies for managing situations where they overlap.
- Navigating the Bermuda Triangle: PFML Private Plan v. State Plans
Our team was joined by a regulator, attorney, carrier, and employer to outline the different use cases and provide audience members with a framework for making a decision about whether they should file a private plan or stay with the state.
2) Mental Health Support
Mental health remains a cornerstone of today’s workplace benefits, and the conference didn’t shy away from tackling this critical issue. Sessions focused on creating a supportive environment for employees experiencing mental health challenges. These discussions provided actionable strategies for maintaining compliance while prioritizing employee well-being:
- I’m Stressed! Managing Psychological Disability Claims in the Workplace
Experts explored best practices for managing mental health claims, with a focus on the unique complexities of psychological disabilities in the workplace.
- Balancing Care and Compliance in the Complex Landscape of Mental Health Accommodations and Leaves
This session helped employers navigate the delicate balance of offering accommodations while staying compliant with ADA and FMLA guidelines.
- The Mental Health LTD Challenge: Because Parity is Not a Priority… Yet
A deep dive into how mental health conditions are handled under Long-Term Disability (LTD) policies and the ongoing challenge of achieving true mental health parity in benefits.
3) Innovations in Leave and Accommodation Management
Technology continues to transform the way employers manage leave and disability claims. This year’s conference highlighted cutting-edge tools and strategies, including the use of artificial intelligence (AI) to streamline compliance processes, as well as other technologies to support for disability management. These sessions explored how employers can leverage technology and data-driven insights to improve leave management and drive better outcomes:
- Artificial Intelligence, Automated Systems, and Leave and Accommodation Compliance
This session explored how AI is reshaping leave management, helping employers automate compliance and improve accuracy in decision-making.
- Transforming Disability Management: Evidence-Based Solutions with Psychedelic-Assisted Therapy
One of the most forward-thinking sessions, this presentation discussed the growing role of psychedelic-assisted therapies in managing mental health conditions in the workplace.
- Remodeling Your RTW/SAW Program with 5 Innovative Tools
Participants learned about five new tools designed to optimize Return-to-Work (RTW) and Stay-at-Work (SAW) programs, improving the experience for both employers and employees.
The 2025 DMEC Compliance Conference provided a comprehensive overview of the challenges and opportunities facing HR and absence management professionals today. From navigating complex compliance requirements to embracing new technologies and supporting employee mental health, the conference highlighted the evolving nature of leave and accommodation management. With valuable insights and actionable strategies, attendees left the conference better equipped to address the needs of their diverse workforces while staying compliant with an ever-changing legal landscape. We’re already looking forward to what next year’s conference will bring!
There was a flurry of activity at the federal level that involved state and local paid family and medical leave (PFML) programs in the days leading up to President Trump’s inauguration. Both the Department of Labor (DOL) and the Internal Revenue Service (IRS) provided additional guidance and clarification, which is summarized in this Alert.
I. DOL Opinion Letter Clarifies Interaction of FMLA and State of Local PFML Programs
As the paid leave landscape has evolved, employers have struggled with how to reconcile compliance with the Family and Medical Leave Act (FMLA) with that of state or local paid family and medical leave (PFML) programs. While running FMLA, PFML, and other leaves concurrently has been a common and often recommended practice, understanding specific rules that apply in these scenarios has long been a concern for employers. The Department of Labor, in recently issued DOL Opinion Letter FMLA2025-1-A, finally addresses the interplay between the FMLA and state or local PFML programs when an employee’s absence qualifies for both.
The core issue explored in the opinion letter is how the FMLA’s “substitution” rule operates in these concurrent leave scenarios, particularly regarding the use of PFML and whether the same principles as those that apply to disability plans and workers’ compensation benefits apply to PFML. The substitution rule generally allows an employee to elect, or an employer to require that an employee, substitute accrued employer-provided paid leave (including vacation, PTO, or sick leave) while also falling under the protections of unpaid FMLA leave, which means that the employee can elect to have, or an employer can require, that the employer-provided paid leave run concurrently with FMLA leave. Employers have long been uncertain how to apply the rule when state or local PFML benefits are also involved.
The opinion letter clarifies that the FMLA substitution rule does not apply when employees receive benefits under a state or local PFML program, just as it does not when the employee is receiving paid disability or workers’ compensation benefits. This clarification means employees can choose, or be required by their employer, to use their state or local PFML concurrently with FMLA leave. The DOL emphasizes that this coordination is permissible even if the state or local law does not explicitly address the interaction with FMLA and offers employers a clearer framework for managing these often complex leave situations.
Another key takeaway from the opinion letter is that using state PFML concurrently with FMLA leave does not diminish the employee’s protections under FMLA. The FMLA’s 12 weeks of leave remain protected, regardless of whether the employee receives state or local PFML benefits during that time, thereby ensuring that employees receive the full federal protection of the FMLA while also accessing state or local benefits.
Additionally, the DOL’s guidance touches upon the implications of PFML providing partial income replacement. If an employer offers employer-provided accrued paid leave benefits in addition to state or local PFML, the opinion letter suggests that these employer-provided benefits can also be used concurrently with FMLA leave to “top off” the PFML benefit.
This opinion letter is significant because it provides much-needed clarity in an area where confusion often arises. The increasing prevalence of state and local PFML programs necessitates clear guidance on how these laws interact with the FMLA. By addressing the substitution rule in this context, the DOL helps employers navigate the complexities of concurrent leave and ensures employees understand their rights and options.
Ultimately, FMLA2025-1-1 aims to streamline the administration of FMLA leave when state or local PFML is involved, promoting a more consistent and predictable approach for both employers and employees. It reinforces the principle that the FMLA provides a baseline of protection, which can be supplemented by state benefits, without diminishing the federal entitlement.
Next Steps for Employers:
Employers should carefully review DOL Opinion Letter FMLA202-1-A and ensure that their current policies and procedures are consistent with the new guidance.
II. Navigating the Tax Implications of State PFML Programs
The rise of state-level PFML programs has brought a wave of tax-related questions from employers, employees, and other stakeholders. Previously, state guidance on PFML taxation was often vague, leaving many to seek expert advice. However, the IRS issued Revenue Ruling 2025-4, providing much-needed clarity on these complex issues.
Federal Tax Implications:
- Employer Contributions: Generally, employer PFML contributions are excluded from an employee’s gross income and are not subject to FICA, FUTA, or federal income tax withholding.
- Employee Contributions: Employee PFML contributions are typically considered after-tax and are therefore not subject to federal taxation. If an employer funds the employee portion, this payment is considered additional compensation and is subject to FICA, FUTA, and income tax withholding.
- Benefits Paid: The tax treatment of PFML benefits depends on whether the leave is for medical or family reasons, and whether the benefit is attributable to employer or employee contributions. Some states specify contribution allocations (e.g., Delaware, Massachusetts, Minnesota, New Jersey, New York), while others do not, potentially creating ambiguity for employers.
- Medical Leave:
- Employer-Attributable Benefits: Included in federal gross income as wages, subject to sick pay reporting rules, and considered third-party payments of sick pay.
- Employee-Attributable Benefits (or Employer-Funded Employee Portion): Excluded from federal gross income.
- Family Leave:
- Employer-Attributable Benefits: Included in federal gross income (not wages). The state must file with the IRS and issue a Form 1099 to the employee.
- Employee-Attributable Benefits (or Employer-Funded Employee Portion): Included in federal gross income (not wages). The state must file with the IRS and issue a Form 1099 to the employee.
- Medical Leave:
State Tax Implications:
State tax treatment of PFML contributions and benefits varies. Employers must consult the specific laws, rules, regulations, and guidance for each state program to ensure compliance.
PFML Contribution Requirements:
In 2025, state PFML programs have varying requirements for employee and employer contributions when the employer participates in the state plan. Exceptions may apply based on employer size or private plan offerings. Consult the specific state program details for accurate contribution requirements.
Next Steps for Employers:
Employers should carefully review Revenue Ruling 2025-4 and any related state guidance. During the 2025 transition period, adjustments to taxation practices may be necessary. This may include updating employee handbooks, policies, FAQs, payroll systems, and other relevant resources. Proactive compliance is crucial, as employers are generally responsible for the correct administration of these programs.
For further questions or assistance regarding either the DOL Opinion Letter or the IRS Revenue Ruling, please contact Spring.
History of MHPAEA
Mental Health Parity is designed to ensure individuals receive equal access to Mental Health and Substance Use Disorder (MH/SUD) benefits as they do for Medical and Surgical (MED/SURG) benefits. This quest for parity began legislatively in 1996 with the Mental Health Parity Act (MHPA), prohibiting insurance companies from imposing more restrictive annual or lifetime dollar limits on mental health benefits than MED/SURG. Since then, many regulations have been passed to help achieve this goal.
- In 2008, the Mental Health Parity and Addiction Equity Act (MHPAEA) incorporated additional provisions, enforcing that financials (copays or deductibles) and treatment limitations (number of visits or days of coverage) were equal, as well as applying all requirements to substance use disorder benefits.
- Additional MHPAEA regulations were published in 2013, providing much more guidance on how to achieve compliance.
- The Consolidated Appropriations Act of 2021 introduced the requirement to perform a comparative analysis of non-quantitative treatment limitations (NQTL), such as preauthorization, network administration standards, or step therapy. However, nearly all the analyses submitted were found insufficient.
Despite previous efforts and regulations, disparities between MH/SUD and MED/SURG benefits have continued to grow over the last 15 years. In 2022, according to the Substance Abuse and Mental Health Services Administration’s (SAMHSA) National Survey on Drug Use and Health (NSDUH), almost 54.6 million people aged 12 and older were diagnosed for needing treatment for substance abuse, and only 24% of that population were able to receive treatment.1 Additionally, a study by RTI International showed that in 2021, out-of-network behavioral health clinician office visits were reported to be 3.5 times higher than all MED/SURG out-of-network office visits.2
Final Rules to the MHPAEA were released by the Departments of Labor, Health and Human Services, and the Treasury on September 9th, 2024, with the intent to rapidly address these barriers. These rules take effect on January 1, 2025, with some requirements having a delayed application until January 1, 2026. The Final Rules expand on previous requirements, provide clarification for group health plans and health insurance issuers to stay compliant with MHPAEA, and aim to eliminate any restrictions on MH/SUD treatments or resources, ensuring the same level of coverage as MED/SURG benefits.
The final regulations are complex and will be cumbersome for all employers, especially those with self-insured plans. At the core of the regulation are two requirements: a Benefit Coverage Requirement and an NQTL Comparative Analysis Requirement.
Benefit Coverage Requirement
This review must ensure that financial requirements and quantitative treatment limitations (QTL) are not more restrictive when comparing MH/SUD and MED/SURG benefits. The final rules remove away from the tests mentioned in 2013 and emphasized that plans cannot impose an NQTL that is more restrictive on MH/SUD benefits compared to MED/SURG benefits. To determine whether the NQTL meets the requirement to be no more restrictive, the plan must satisfy both a Design and Application Requirement as well as a Relative Data Evaluation Requirement.
Design and Application Requirement: Plans must show that the processes, strategies, evidentiary standards, and other factors used when both designing and applying the NQTL are comparable, rather than the previously only evaluating the application itself. Additionally, a key provision prohibits using discriminatory factors or evidentiary standards when designing the NQTL.
When evaluating the plans, the regulation is clear that health plans must provide “meaningful benefits,” which entail covering at least one core treatment in each category for MH/SUD benefits, as they do for MED/SURG. The six recognized categories are emergency services, in-network inpatient, out-of-network inpatient, in-network outpatient, out-of-network outpatient, and prescription drugs. For example, if a health plan covers a hospital surgery in the inpatient category, it must also provide access to mental health treatment, such as inpatient psychiatric care, in the same category. If they provide antibiotics in the prescription drugs category, they must also provide antidepressants.
Data Evaluation Requirement: Plans must collect and evaluate data to assess the relevant outcomes of applying the NQTL. Plans and issuers must identify material differences in access to services and take reasonable action to address them. Although the Departments will not provide a set list of required data, they expect plans to collect data relevant to most NQTLs, allowing flexibility based on the NQTL in question. If data is lacking, plans must state why it is missing, how they will collect it in the future, or provide a reasoned justification concluding no data exists.
If the Departments determine that the NQTL is more restrictive and that the above requirements are not met, they can enforce plans to stop imposing the NQTL on their MH/SUD benefit offering.
NQTL Comparative Analysis Requirement
The Final Rules reiterate the need for an NQTL comparative analysis, which has been a requirement since the CAA (2021). The analysis requirements are robust, requiring the Plan to explain how and why the Benefit Coverage Requirements are satisfied within their NQTL Comparative Analysis. This narrative must be detailed and include the following Content Elements:
- Description of the NQTL, including identification of benefits subject to the NQTL
- Identification and definition of the factors and evidentiary standards used to design or apply the NQTL
- Description of how factors are used in the design or application of the NQTL
- Demonstration of comparability and stringency, as written
- Demonstration of comparability and stringency, in operation, including the required data, evaluation of that data, explanation of any material differences in access, and description of reasonable actions taken to address such differences
- Findings and conclusions
This analysis must consider all facets of the plan, including core treatment, standards of care, utilization, access, networks, prior authorizations, etc. The plan must assess any material differences and what meaningful actions are being taken to ensure compliance.
For ERISA-covered plans, the named plan fiduciary must verify an appropriate analysis was conducted with a prudent process. Fiduciaries are also responsible for continually monitoring the plan and compliance with the NQTL analysis.
The comparative analysis must be readily available upon request and provided within the specific timeframe: 10 business days for the relevant Secretary, and 30 days for participants or beneficiaries. If an insufficient analysis is determined, plans must submit additional information within 10 business days. If there is an initial determination of noncompliance, they have 45 calendar days to make corrections. If there is a final determination of noncompliance, the plan must inform all enrolled participants and beneficiaries within 7 days and provide the Secretary with a copy of this notice, along with the names of everyone involved in the process.
Action Plan
The Departments recognize that employers with self-insured health plans rely on TPAs and service providers for plan administration and understand the challenges in obtaining the necessary comparative analyses or required data. However, plans and issuers are ultimately responsible for compliance with MHPAEA. If you don’t already have a comparative analysis on hand, it should become a top priority due to the quick turnaround response times outlined. It is recommended to consult with a legal partner for an in-depth analysis. Additionally, the MHPAEA Final Self-Compliance Tool, finalized in 2020, serves as a valuable resource, guiding plans and issuers to meet compliance with MHPAEA’S parity requirements. This tool has not been updated, but that is expected.
The Final Rules generally apply starting January 1, 2025, though provisions like meaningful benefits and certain comparative analysis requirements are delayed until January 1, 2026, to give employers more time to comply.
Although we recommend that employers carefully examine their plans and work toward immediate compliance, a lawsuit has been filed and more are anticipated. The lawsuit from ERIC (The ERISA Industry Committee) indicates that the new regulations are fundamentally flawed, exceed the statutory authority that Congress provided to the agencies and threaten the ability to offer quality and affordable benefits in compliance with applicable laws.
1 SAMHSA (2023), Key substance use and mental health indicators in the United States: Results from the 2022 National Survey on Drug Use and Health (HHS Publication No. PEP23-07-01-006, NSDUH Series H-58), https://www.samhsa.gov/data/report/2022-nsduh-annual-national-report.
2 Mark, T.L., Parish, W. (2024), Behavioral health parity—Pervasive disparities in access to in-network care continue, RTI International, https://dpjh8al9zd3a4.cloudfront.net/publication/behavioral-health-parity-pervasive-disparities-access-network-care-continue/fulltext.pdf.
We recently published an article on Neebc.org spotlighting some Paid Family and Medical Leave updates across New England in 2025. You can find the full article here.
In today’s rapidly evolving workforce, one-size-fits-all benefits are no longer sufficient to meet the diverse needs of employees. As expectations shift toward personalized and flexible offerings, voluntary benefits are emerging as a vital solution. These supplemental programs empower employees to customize their benefit packages by adding coverage tailored to their unique personal, health, and financial circumstances.
For employers, voluntary benefits offer significant advantages, including enhanced employee engagement, improved retention rates, and a more comprehensive approach to wellness. Additionally, since employees often bear the cost of these programs, they present a low-risk, cost-effective investment that boosts satisfaction and productivity.
What Are Voluntary Benefits?
Voluntary benefits are optional, supplemental offerings provided by employers in addition to traditional health insurance and retirement plans. These benefits are typically employee-paid, allowing individuals to select the coverage that best meets their needs.
Common examples of voluntary and supplemental benefits include:
- Health and Wellness Coverage: Critical illness, hospital indemnity, accident insurance, dental, vision, and other health-related services
- Financial Support: Life insurance, accidental death and dismemberment (AD&D) insurance, disability insurance, long term care, and other financial safety nets for employees and their families
- Legal Protections: Legal services, identity theft protection, and other personal security-related offerings
- Pet Insurance: Coverage for employees’ pets, offering financial protection in case of veterinary emergencies.
This graph breaks down the most common insurance benefits offered according to Alera Group’s 2024 Employee Benefits Survey:
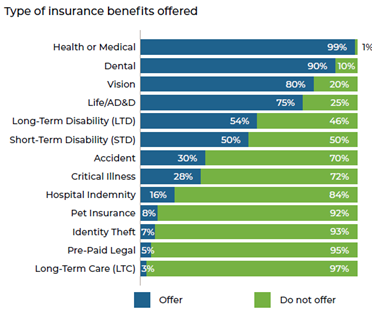
Meeting Employee Needs: The Rise of Voluntary Benefits
As the workforce becomes more diverse, employees are seeking benefits that go beyond traditional offerings. Over 75% of employers offer Medical, Dental, Vision, Life, and AD&D, with the number and type of benefits varying by employer size. Larger employers tend to offer a greater variety of benefits and are more likely to offer supplemental products, such as pet insurance. Employees want to feel valued, and a broad range of benefits demonstrate an employer’s commitment to their well-being, while also allowing employees to select products that best fit their needs.
Voluntary benefits align with the growing demand for personalized, flexible workplace solutions. With more employees working remotely and managing diverse personal circumstances, the ability to choose supplemental benefits has become increasingly important.
The Value of Voluntary Benefits for Employers and Employees
For Employees:
- Customization: Employees can select the benefits that best fit their lifestyle, such as additional health coverage, financial protection, or wellness services
- Financial Accessibility: Group rates make many voluntary benefits more affordable compared to individual plans
- Peace of Mind: A broader range of benefits provides employees with greater confidence in managing health, financial, and personal challenges
For Employers:
- Attracting Top Talent: A comprehensive suite of voluntary benefits enhances an employer’s appeal to prospective employees
- Improved Employee Engagement: Employees who feel supported by robust benefits are more likely to remain engaged and productive
- Cost Efficiency: Since employees typically cover the costs, employers can expand their benefits offerings without significant additional expenses
How Can Employers Implement Voluntary Benefits?
To introduce voluntary benefits successfully, employers should follow these steps:
1. Understand Employee Needs
Use employee surveys or analyze workplace trends and healthcare data to identify areas where employees might benefit from additional support, such as health coverage, financial protection, or wellness initiatives.
2. Evaluate Vendors and Packages
Assess potential vendors and benefits packages based on factors like cost, employee participation rates, and ease of administration. Ensure employees have easy access to these benefits and understand their value.
3. Communicate and Educate
Clear communication and ongoing education are crucial. Employers should regularly inform employees about available options, provide updates, and encourage participation.
Voluntary benefits are becoming an essential tool for employers seeking to support their workforce in ways that go beyond traditional offerings. By offering flexibility and choice, voluntary benefits empower employees to address their personal health, financial, and well-being needs while helping employers enhance engagement, retention, and overall satisfaction.