Our Actuarial Team teamed up with Alera Group experts on this COVID-19 and Mental Health Trends whitepaper which looks at the post-pandemic mental health landscape, including impacts on employees, children, plan costs, care gaps, and substance abuse.
In collaboration with Alera Group, our Actuarial Team helped create a whitepaper which provides guidance around eligibility, procedures, and plan costs for coverage of over-the counter COVID-19 tests within health plans, as mandated by President Biden. You can find the full whitepaper here.
Spring has been selected to help the Maryland Department of Labor (MDL) more effectively implement and administer the Family and Medical Leave Insurance (FAMLI) Program. Check out the press release here.
At the VCIA 2022 Annual Conference, our Managing Partner participated in a panel that highlighted the scary long-term care landscape, but that ended on a high note in exploring the possibility of captives as a next generation solution for long-term care insurance.
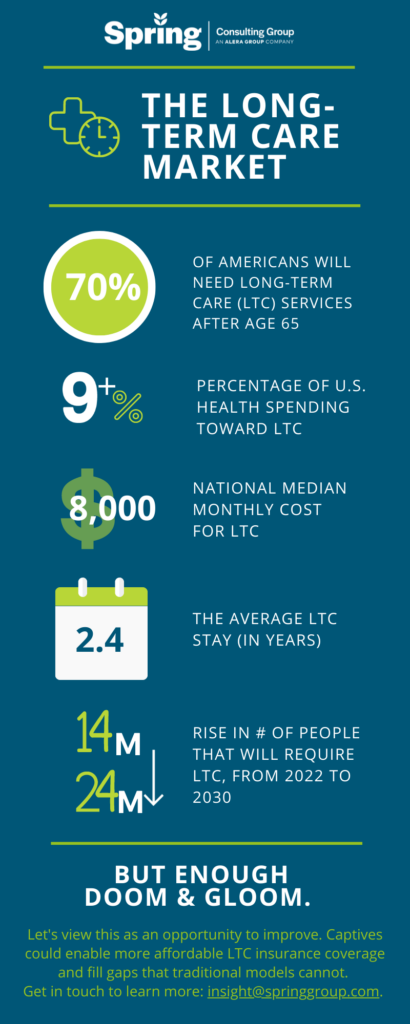
With innovation embedded in the DNA of both Spring and captive insurance, we are interested in helping reshaping the long-term care market of the future. Check out the other discussions our team members had on VCIA session panels, or get in touch to talk in more detail about long-term care captive strategies.
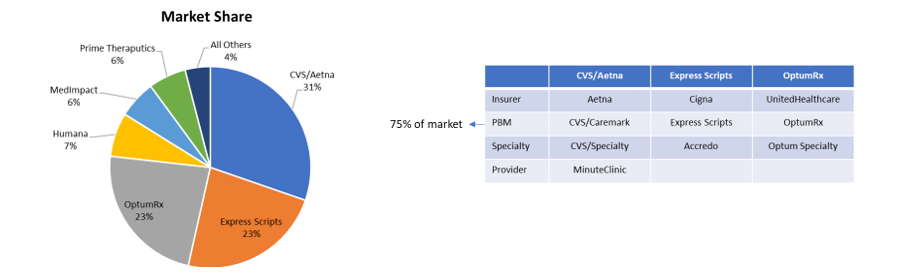
Pharmacy Benefit Managers (PBMs) serve as intermediaries between insurance companies, pharmacies, and drug manufacturers. Large PBMs are often accredited with securing lower drug costs through volume discounts and aggressive negotiations with manufacturers, which has the potential to make prescription medication more affordable. Unfortunately, many large PBMs lack the transparency that would be required to validate their impact on the cost of prescriptions.
As employers work to find optimal partners, it is important to understand the primary PBM models available in the market and how they align with each employer’s corporate culture. Each model has its own set of pros and cons, so there is not one optimal solution. The key when evaluating is to understand the strengths and weaknesses of the model you are leveraging so you continue to move toward the best approach for your organization and employees. At a high level there are three types of PBM pricing models:
- Traditional Pricing
- Pass Through Pricing
- Hybrid
Traditional Pricing
In Traditional Pricing, also known as spread pricing, PBMs are reimbursed at a higher rate by health plans and self-insured employers than what they are paying manufacturers and pharmacies for the drug. The PBM keeps the difference to offset their administrative costs as well as profit margins. This model is sometimes referred to as spread pricing, which is leveraged by most of the largest PBMs in the market. The model has been highly scrutinized as very little financial data is available and contractual gag clauses often leave insurers and employers with little knowledge of the actual price of the drug. In addition, some prescriptions also have a rebate payment made but only aggregate information is shared, making it impossible for health plans and employers to understand the true cost. With that said, given the buying power of these large PBMs, even with increased spread, employers may still save money within a traditional pricing model.
Pass-Through Transparent Pricing
The Pass-Through Transparent model operates based on the actual costs of the drugs. Clients are billed the amount the PBM is paying the manufacturer and/or pharmacy. All Rx rebates and discounts are passed onto the client. The PBM is compensated not through traditional/spread pricing but through an administrative charge, typically at the prescription level. Although this model seems more economical, PBMs leveraging a pass-through model may not always have the buying power of the traditional pricing PBMs and therefore savings may or may not be realized by health plans or self-insured employers. It is often hard to quantify savings in advance since pharmacy utilization under traditional pricing PBMs are steering utilization to those prescriptions that have the most margin for the PBM in the form of discounts and rebates.
Hybrid
The Hybrid model is a mix between the Traditional Pricing and Pass-Through Transparent models. In this model, rebates and discounts are typically passed to client(s), but it may or may not be in full. Some hybrid models indicate all received rebates are passed back to clients but may have an intermediary that receives some spread that is not disclosed and not considered a rebate. In short, hybrid PBMs have diverse disclosure practices. At a quick glance it may seem more transparent, but it’s difficult to validate.
Solving for the Transparency Issue

With the lack of transparency, some policies at the state and federal level aim to decrease the complexity. For example, most states with transparency laws require reporting from manufacturers when wholesale cost is increased above a certain threshold. The first drug transparency law was passed in 2016 in Vermont, but now over 20 states (including CA, CT, ME, MN, NV, NH, ND, OR, TX, UT, VA, WA, WV) have implemented their own requirements. Maine has one of the more robust approaches, collecting and analyzing the data with the goal of identifying each supply chain’s average net, allowing the public and policymakers to follow the money through the supply chain[1].
The Consolidated Appropriations Act also has requirements for pharmacy reporting that will require PBMs to report on some data that is rarely shared, including but not limited to rebates by drug for the top 25 prescriptions. In some instances, PBMs will share that data with health plans and self-insured employers; in other instances, they will file directly with Centers for Medicare & Medicaid Services (CMS) without employers understanding those plan details.
More recently, on May 24, 2022, the Pharmacy Benefit Manager Transparency Act of 2022 was introduced. Sponsored by Senator Chuck Grassley (IA) and Senator Maria Cantwell (WA), this bill will empower the Federal Trade Commission (FTC) to increase drug pricing transparency and hold PBMs accountable for unfair practices that increase cost. It also will require PBMs to report to the FTC the amount of money they make through spread pricing and pharmacy fees[2].
While we wait to see if the Pharmacy Benefit Manager Transparency Act is passed, other solutions are available. There are companies that are striving to help clients save money when it comes to prescription drug costs. They often run analyses on current employer prescription drug costs to determine how much they could save if they moved away from traditional PBM models.
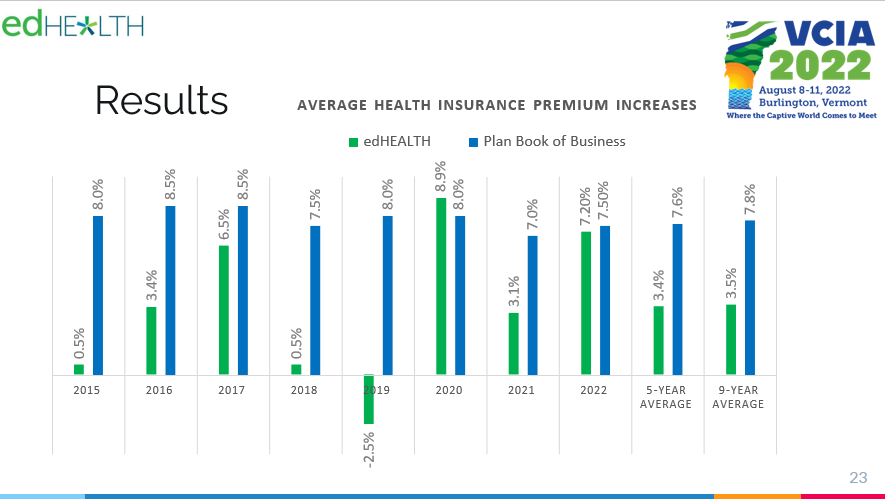
At edHEALTH, we work hard with our member-owner schools to bend the trend in healthcare costs. Pharmacy continues to be an expensive cost-driver, at a national level, and something we’re addressing head-on. We continuously look for opportunities to bend the trend in healthcare costs, including exploring all options to reduce prescription drug costs.
Tracy Hassett, President and CEO of edHEALTH
When our client, edHEALTH, carved-out prescription drug benefits, the goal was to provide additional savings and transparency to its members. edHEALTH continues to work with their vendors and evaluate various options so that they can offer additional transparency and cost savings. To learn more about potential solutions, talk to your current advisor or reach out to Spring Consulting Group.
[1] https://www.nashp.org/drug-price-transparency-laws-position-states-to-impact-drug-prices/
[2] https://www.natlawreview.com/article/pbms-continue-to-draw-federal-scrutiny-pbm-transparency-act-2022#:~:text=The%20Pharmacy%20Benefit%20Manager%20(PBM,and%20state%20attorneys%20general%20in
In our latest podcast on Global Captive Podcast, our Managing Partner is joined by President and CEO of Spring’s client, edHEALTH to discuss the evolution of the captive program and its success.
Executive Summary
Musculoskeletal (MSK) conditions are a driving force behind healthcare spending, representing an estimated 17% of all spending in the US healthcare market. In addition, MSK conditions are the leading contributor to disability worldwide.1 Some examples of MSK conditions include osteoarthritis, rheumatoid arthritis, osteoporosis, sarcopenia, back and neck pain, and fibromyalgia.2 MSK pain may be acute or chronic, localized or affecting the entire body.3 Additionally, conditions may or may not be related to work, creating an added layer of difficulty in understanding the condition and addressing individual patient needs.
Many models currently exist that attempt to control costs related to MSK conditions. While the vendors providing these programs are confident in their success, it can be difficult for employers to select a program that addresses the needs of all employees with relevant conditions. Therefore, a thorough and ongoing review of organizational health data is necessary. For example, what a hospital needs in an MSK program may vary greatly for an employer operating solely out of an office setting. When reviewing workers’ compensation claims, how many are MSK related? If there is a concern, employers may want to start by implementing ergonomic reviews where the employee works to ensure there is nothing at work that is negatively impacting the employee. Other attempts to address MSK costs focus on care and treatment after the injury or disorder exists such as overall wellness programs, one-on-one coaching, and digital physical therapy offered as an employee benefit.
What is the impact on healthcare spend?
– Musculoskeletal (MSK) conditions are the top cost driver of healthcare spending, followed by heart disease, cancer, and diabetes.
– The average health cost per member with MSK condition increased by 40% between 2010 and 2019.
– COVID-19 aggravated this trend as more workers shifted to remote work; 70% of employees with MSK conditions experienced new or increased pain.4
-The Department of Labor’s Bureau of Labor Statistics estimates that about 30% of workers’ compensation injuries fall under MSD.5
As costs have increased, traditional approaches to treating MSK conditions have not shown a corresponding improvement in patient outcomes. This may include surgery, advanced imaging, injections, and pain management.6 It may be time to consider alternative treatment options to appropriately address these rising costs and employee pain levels.
What alternative models exist?
As employers, employees and providers begin to understand that traditional treatment options may not be the best approach for specific cases, alternative approaches have grown in popularity. Workers’ compensation claimants receiving opioids dropped from 55% to 24% between 2012 and 2018, while there was a 131% increase in the use of massage to address chronic pain, a 26% increase in the use of orthotics, and a 15% increase in the use of physical therapy, according to the National Council on Compensation Insurance (NCCI).7
Employers who have identified a significant impact of MSK conditions on their claim costs should seek programs that can be added to their benefit offering. There is a large market for these alternative treatment options, some components of which are listed below:
- Digital physical therapy clinics using wearable technology
- Pain relief wearable technology
- Custom physical therapy programs and coaching, in person or remote
- Case review by leading medical providers
- Therapy addressing psychology and education of conditions and pain
- Remote work ergonomics
- Focus on chronic pain management
- Corporate wellbeing programs
Specialty MSK vendors track data that implies overall success including a 50% to 70% reduction in pain, 40% to 75% reduction in anxiety and depression, increased adherence and participation in programs, surgery avoidance, and return on investment for employers.
What should I do as an employer interested in an MSK program?
Employers must begin by understanding the cost associated with musculoskeletal conditions within their population, as well as the range of conditions employees may be experiencing. If costs (medical and pharmacy) are significant or increasing, employers should consider alternative programs that would benefit employees and the plan. Identifying a pattern may demonstrate the need for a specific approach like preventive programs or ergonomic assessments.
From there, market research will be necessary to understand pricing and select a vendor with the best program for your population. Spring’s consultants are here to help with market research, claims and data analysis, and/or a Request for Proposal (RFP) process so that you find a solution that best meets your organizational needs.
1https://www.businessinsurance.com/article/00010101/NEWS08/912336312/Musculoskeletal-disorders-in-comp-highlight-prescribing-changes, https://www.who.int/news-room/fact-sheets/detail/musculoskeletal-conditions
2https://www.who.int/news-room/fact-sheets/detail/musculoskeletal-conditions
3https://my.clevelandclinic.org/health/diseases/14526-musculoskeletal-pain
4https://healthactioncouncil.org/getmedia/a738c3c5-7c23-4739-bb8d-069dd5f7406b/Hinge-Health-State-of-MSK-Report-2021.pdf
5https://www.businessinsurance.com/article/00010101/NEWS08/912336312/Musculoskeletal-disorders-in-comp-highlight-prescribing-changes
6State of MSK Report 2021, Hinge Health
7https://www.businessinsurance.com/article/00010101/NEWS08/912336312/Musculoskeletal-disorders-in-comp-highlight-prescribing-changes
Coming out of our COVID haze, it can be difficult to remember a time when employers could be truly strategic and proactive without priorities evaporating due to lockdowns, staffing shortages, travel bans or taking a U-turn due to pressures in other areas of the business. The time is now to pivot back to your strategic plans related to employee benefits. We recommend the road to an optimal benefits program be lined with solutions to specific pain points and cultural considerations at your organization. However, I advise at least considering the following within your strategic roadmap to see if they are a fit and can close gaps within your current program.
1) Employee Surveys
Priorities within your workforce have likely changed considerably in the past two to three years. If you haven’t asked employees about their priorities related to employee benefits, it is time! Some of your more traditional benefits or office-affiliated perks that may have been linked to attraction and retention in the past are no longer a value add to employees. It is not enough to talk about perks and flexibility; needs must be better understood to ensure you are providing something that actually attracts and retains talent, instead of the
2) Lifestyle Accounts
Financial accounts within employee benefits are not new (e.g., a Flexible Spending Account), but recently employers have started using these account-based perks in different ways to fill a gap that exists in their offering while providing ultimate flexibility. These accounts are taxable but can be used within the parameters set by the employer. Organizations may use them to support just about anything, but common categories today include:
– Medical procedures that may not be covered within the medical plan (i.e., infertility services, elective procedures, etc.)
– Travel expenses for medical services
– Family-focused benefits (i.e., doula, etc.)
– Legacy wellness support (i.e., fitness equipment, fitness classes)
The beauty of these services is that they can be selected based on employee needs as well as organizational culture and budget.
3) Absence Policies and Processes
Diversity, equity, and inclusion (DEI) are at the top of the list of internal initiatives, and goals are uniquely defined based on how much progress has already been made. It goes without saying that DEI is critical to the success of all companies, but I think a key area of DEI that requires some additional attention is your corporate absence strategy. Over the past few years, organizations have developed additional absence policies around COVID-19 and Monkey Pox, but there has also been a large push toward more family-focused leave of absences surrounding bereavement, parental leave, and the like. It’s important that DEI initiatives within employee benefits focus not only on the services but also on the time off that may be required, and viewing this through the many lenses of your diverse workforce.
4) Oncology Support
As benefits professionals, we have worked diligently to identify point solutions for high-cost and highly disruptive conditions. While point solutions continue to be part of a strong strategy, most employers have or will see an increase in oncology prevalence and spend due, in part, to expensive treatments but primarily driven by disrupted or delayed care and screenings.
Initial concerns with COVID-19 not only decreased primary care visits but snowballed, as providers later had limited appointments available due to overwhelming demand, which has translated into undiagnosed cancers. Now as participants are getting back to their primary care physicians, many cancers have progressed further or upstaged, creating the need for more intense and complex treatment.

In addition to the direct cost of cancer care, employee productivity is significantly less after a cancer diagnosis, even if that diagnosis is within their extended family.
Spring encourages employers to seek a proactive and holistic approach to oncology support, including some or all the following:
– Monitor screening engagement
– Encourage prevention including reminders and other communications; consider incentives
– Educate and support initial and ongoing care decisions
– Concierge support
– Clinical support
Of paramount importance is to educate and engage employees before a diagnosis, so they know where to go for initial support. Those first few weeks after a diagnosis are critical to setting the stage for appropriate treatment and clinical review and/or second opinions. There are some free and buy-up options in the market provided by top-tier cancer care providers/facilities. Those have brand recognition and are designed to provide unbiased support but, in many cases, they also funnel patients to their service centers. Another consideration available is point solutions that are agnostic to cancer care providers/facilities and provide concierge support but do have an add-on charge, typically as a per employee per month (PEPM) or per referral model.
5) Healthcare Disparities
One of the most complex items that should be on your roadmap is to examine what healthcare disparities exist in your population. For starters, ensure multilingual communications are available to close healthcare gaps for those with language barriers. From there, it is important to begin to stratify your population – if your size warrants – and begin to examine if health outcomes are impacted by race, location, earnings, and/or other social determinants of health. This strategic initiative must be performed in collaboration with your insurers and third-party administrators and will take dedicated time to set a methodology and refine your findings over time. The key is to at least get started by looking at the data and talking about how you can improve your understanding of the current state to work toward better data in the future.

Setting the strategic plan for your employee benefit package should be customized to your organization’s priorities and complexities that are identified through claims experience and survey information. Given each organization has its own culture, demographics, and business priorities, it is impossible to set a perfectly standard list of considerations when it comes to your employee benefit strategy. But as you drive toward the best vision for your company – off in the horizon – be sure to stop along the way to check out these five hotspots of benefits planning.
Spring frequently helps employers assess different solutions, plans, and programs and build them into their roadmap. One client, edHEALTH, is currently organizing three solution committees to refine areas of opportunity and prioritize solutions based on demand and change readiness.
With healthcare costs skyrocketing and employee needs shifting, many employers are examining how they can save money while still providing strong benefits packages. Last week I spoke at the Vermont Captive Insurance Association (VCIA)’s 2022 Annual Conference on current medical stop-loss market trends and how captives can help cut costs. My fellow panelist, Tracy Hassett, President of edHEALTH, a collection of educational institutes and client of Spring’s spotlighted their captive which has seen significant savings.
Cost of Healthcare
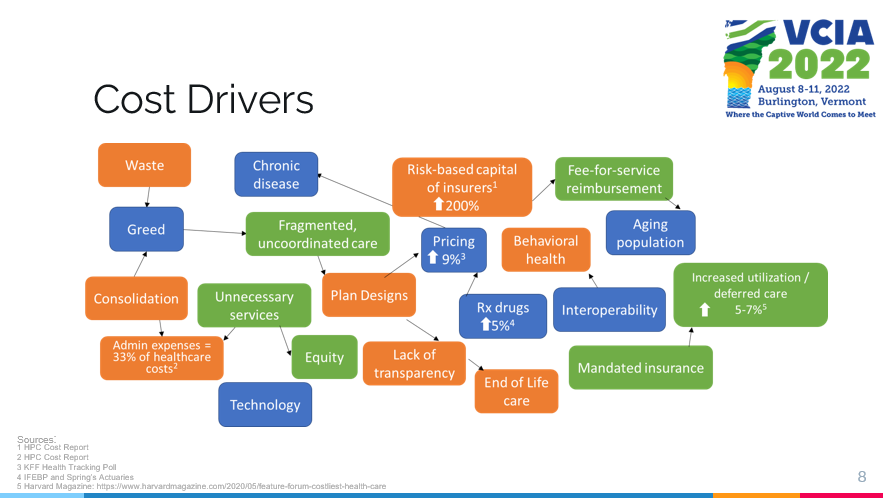
Healthcare costs keep climbing for both employers and employees and our actuaries predict an increase in medical trends for 2022 between 4%-7%. Looking back further, within the past decade healthcare costs have risen roughly 80% for employees and 60% for employers while economic growth has been consistent at 2.5% annually. This increase in costs is coming from a range of factors including administrative expenses, prescription drug prices, increased utilization/deferred care, and risk-based capital of insurers.
We are also seeing a transition in what employees want out of their benefits packages. Our working population is changing; boomers are retiring and transitioning from employer health insurance to Medicare. Millennials have different needs and are looking for straightforward and convenient benefits without high costs. These shifts in healthcare priorities along with high costs have slowly made self-insurance the norm, with a Spring survey reporting 64% of all employers are now self-insured.
When looking at the healthcare market the vast majority of pharmacy spending is through pharmacy benefit managers (PBMs). Employers estimate outpatient pharmacy to be about 18% of health spending, with an additional estimated 10% within medical claims. Also in 2020, overall drug spending rose by almost 5%, with utilization and new drugs driving most of this increase.
Self-Insurance
We are seeing a fundamental change in the healthcare market, and all parties within the healthcare continuum are being asked to handle risk and chase healthcare dollars. This has pushed many employers to move towards self-funding plans which allow for greater customization, more control over risk, and potential cost savings. Many of these self-insured programs are looking at putting medical stop-loss into a captive, with a Spring survey reporting that although less than 50% of self-insured programs have stop-loss coverage, 42% of those that do have it within a captive.
Within the COVID era we have also seen many changes in the industry and numerous employers are reevaluating their healthcare packages. There has been a giant spike in mental health and COVID-19 resources like telehealth, and a decline in elective surgery. These trends have left hospitals and providers with the short end of the stick, leaving self-insured employers and health plans as the parties saving the most in the insurance landscape.
Case in Point: edHEALTH
Tracy Hassett led the case study portion of the presentation, with edHEALTH being a prime example to of a captive successfully yielding savings in healthcare costs as well as flexibility of options. edHEALTH is a consortium of 25 higher education institutions who came together (originally as a group of six schools) to bend the trend in rising healthcare costs. Today, edHEALTH covers almost 15,000 employees (~30,900 lives) and aim to better understand and control their healthcare costs and risk. Tracy explained edHEALTH’s captive structure and how the captive retained savings of $6.7M since inception through 2020, in addition to paying out $3.2M in dividends.
These universities all have similar risks when it comes to healthcare, so investing in a group captive was the ideal solution. Each member chooses their own level of risk and pays for their own claims (below the established self insured retention level [SIR]), but still has control of their program. Tracy continued to explain how prescription drug costs are one of their largest challenges when trying to save money in creating/reevaluating healthcare plans. However, with their captive in the past four years edHEALTH members have saved an estimated $50M on Rx costs.
All in all, I was honored to join in the thought-provoking discussions that took place at VCIA. Since medical stop-loss is one of the biggest areas of focus for our clients right now, it was a pertinent conversation and I was glad to have the opportunity to share my perspective, as well as the success of edHEALTH. Burlington remains as perfectly quaint as ever, and I look forward to next year’s event.